Elasticsearch+Kibanaを触ってみた時の備忘です。
構築、ログイン、軽くサンプル触るまでが対象です。
利用するイメージは2023年12月の最新版である8.11.1を利用しています。
古い7系バージョンのイメージだと認証周りの手順は不要です。
利用するDockerファイル
- docker-compose.yml
version: '3.8'
services:
  elasticsearch:
    image: docker.elastic.co/elasticsearch/elasticsearch:8.11.1
    container_name: elasticsearch
    environment:
      - discovery.type=single-node
      - bootstrap.memory_lock=true
      - "ES_JAVA_OPTS=-Xms512m -Xmx512m"
    ulimits:
      memlock:
        soft: -1
        hard: -1
    volumes:
      - esdata:/usr/share/elasticsearch/data
    ports:
      - 9200:9200

  kibana:
    image: docker.elastic.co/kibana/kibana:8.11.1
    container_name: kibana
    environment:
      - ELASTICSEARCH_URL=http://elasticsearch:9200
      - I18N_LOCALE=ja-JP
    ports:
      - 5601:5601
    depends_on:
      - elasticsearch

volumes:
  esdata:
    driver: local
- ファイル内容の解説
ChatGPT
- バージョン:
version: '3.8'は、このファイルが使用するDocker Composeのバージョンを指定します。ここではバージョン3.8を使用しています。- サービス:
servicesセクションでは、実行する各コンテナに関する設定を行います。- Elasticsearch:
elasticsearchは、Elasticsearchサービスの設定を行います。image: 使用するDockerイメージ。ここではElasticsearchのバージョン8.11.1を指定しています。container_name: コンテナの名前をelasticsearchとしています。environment: 環境変数の設定。シングルノードクラスタの設定、メモリロックの有効化、Javaのヒープメモリサイズの指定が含まれます。ulimits: コンテナのリソース制限を設定。ここではメモリロックの制限を解除しています。volumes: ホストとコンテナ間でデータを永続化するためのボリュームを指定。esdataボリュームをElasticsearchのデータディレクトリにマウントしています。ports: ホストとコンテナ間のポートマッピング。Elasticsearchのデフォルトポート9200を公開しています。- Kibana:
kibanaは、Kibanaサービスの設定を行います。image: 使用するDockerイメージ。ここではKibanaのバージョン8.11.1を指定しています。container_name: コンテナの名前をkibanaとしています。environment: ElasticsearchのURLとインターフェースの言語設定(日本語)を行っています。ports: ホストとコンテナ間のポートマッピング。Kibanaのデフォルトポート5601を公開しています。depends_on: KibanaがElasticsearchに依存していることを示します。これにより、Elasticsearchが起動した後にKibanaが起動します。- ボリューム:
volumesセクションで、使用するボリュームを定義しています。ここではesdataという名前のローカルドライバを使用するボリュームを定義しています。これはElasticsearchのデータの永続化に使用されます。
実操作
前提:Docker DeskTopが立ち上がっていること
上記ファイルを配置した階層で、以下コマンドを実施
docker-compose up -dブラウザで以下URLにアクセス
http://localhost:5601ログインするための認証情報を発行
elasticsearchのコンテナで以下コマンドを実施
elasticsearch-create-enrollment-token --scope kibana出力内容
WARNING: Owner of file [/usr/share/elasticsearch/config/users] used to be [root], but now is [elasticsearch]
WARNING: Owner of file [/usr/share/elasticsearch/config/users_roles] used to be [root], but now is [elasticsearch]

{224文字の登録用トークン文字列}
WARNINGは無視して問題ありません。
上記で発行された登録用トークン文字列を入力
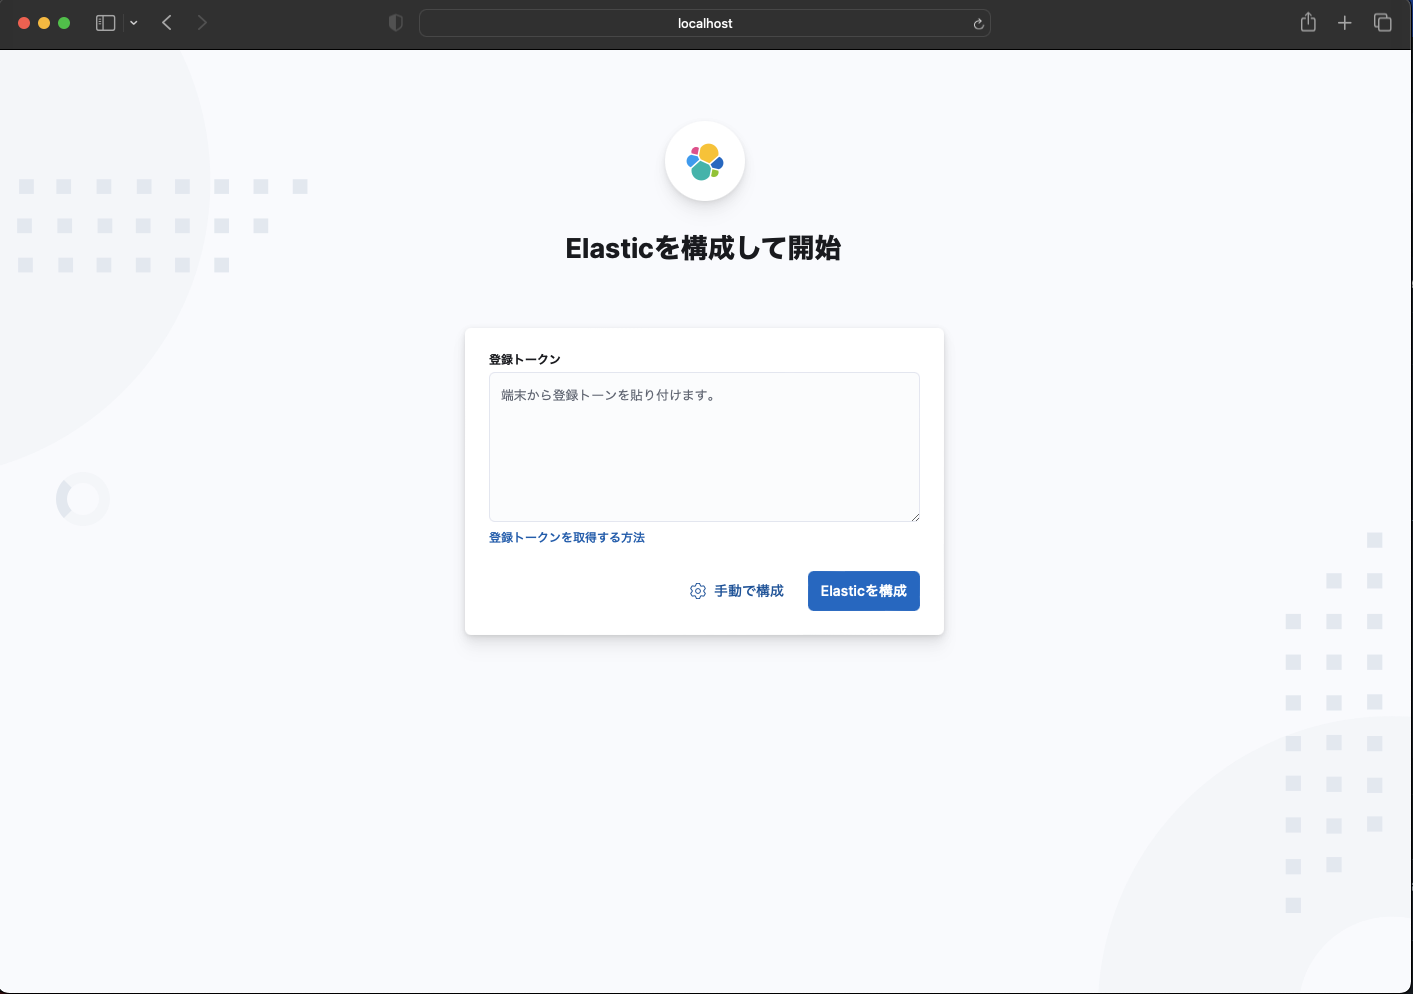
Kibanaのコンテナで以下コマンドを実施
kibana-verification-code出力内容
Kibana is currently running with legacy OpenSSL providers enabled! For details and instructions on how to disable see https://www.elastic.co/guide/en/kibana/8.11/production.html#openssl-legacy-provider
Your verification code is:  {6つの数字}
上記で出力された認証コードを入力
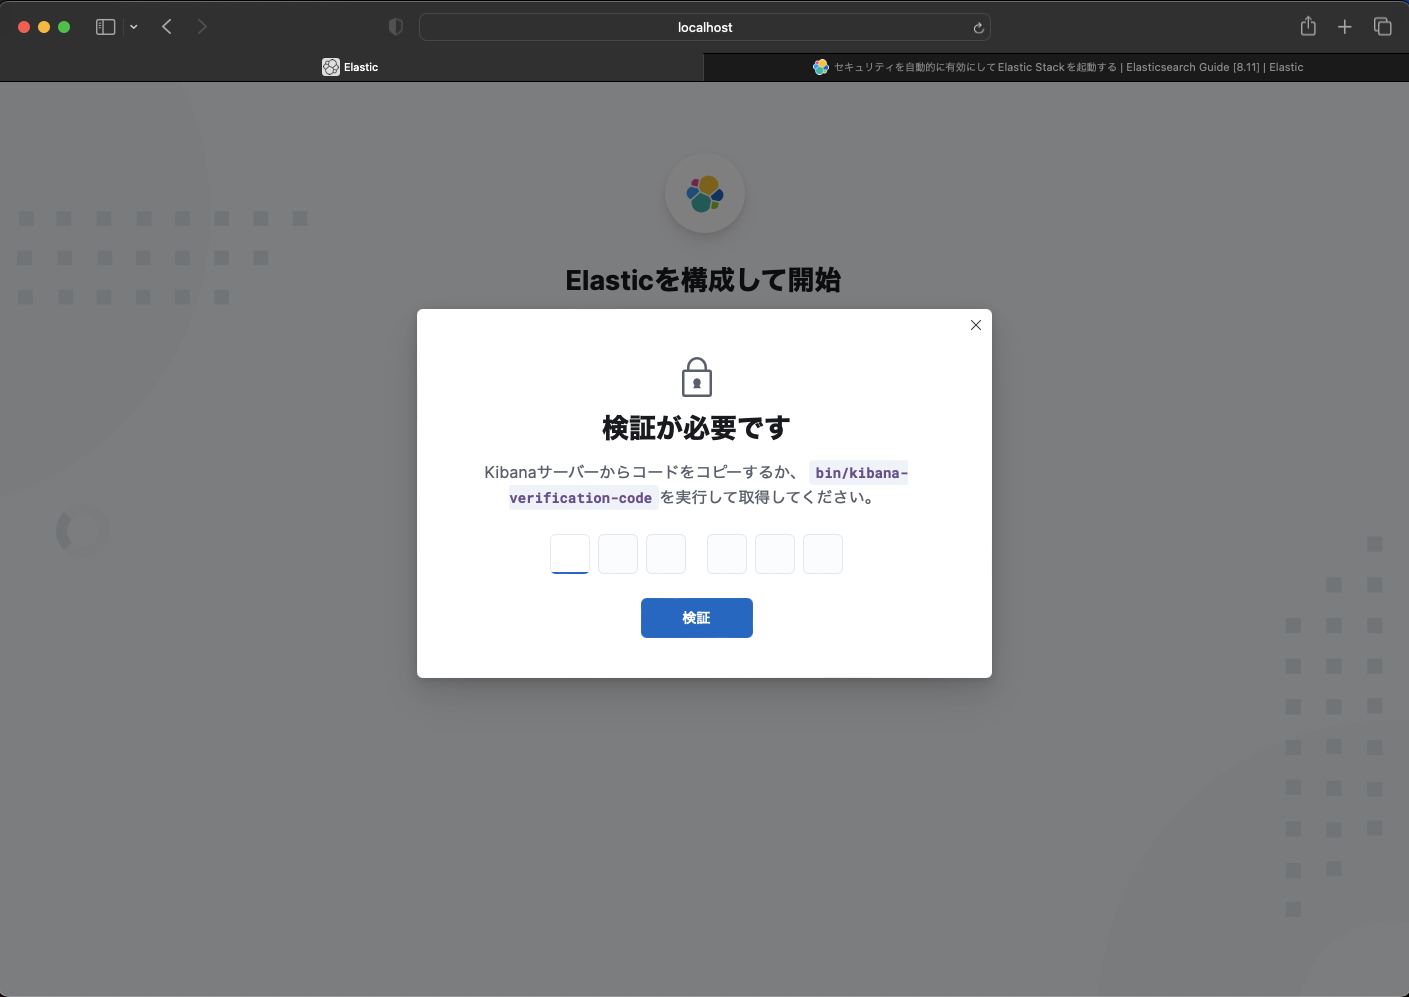
elasticsearchのコンテナでパスワード変更コマンドを実施
/usr/share/elasticsearch/bin/elasticsearch-reset-password -u elastic ユーザーはデフォルトで、「elastic」になっています。
生成内容
This tool will reset the password of the [elastic] user to an autogenerated value.
The password will be printed in the console.
Please confirm that you would like to continue [y/N]y
⇨ y

Password for the [elastic] user successfully reset.
New value: {パスワード文字列}
上記内容を入力すると、ログインしてホーム画面に遷移します。
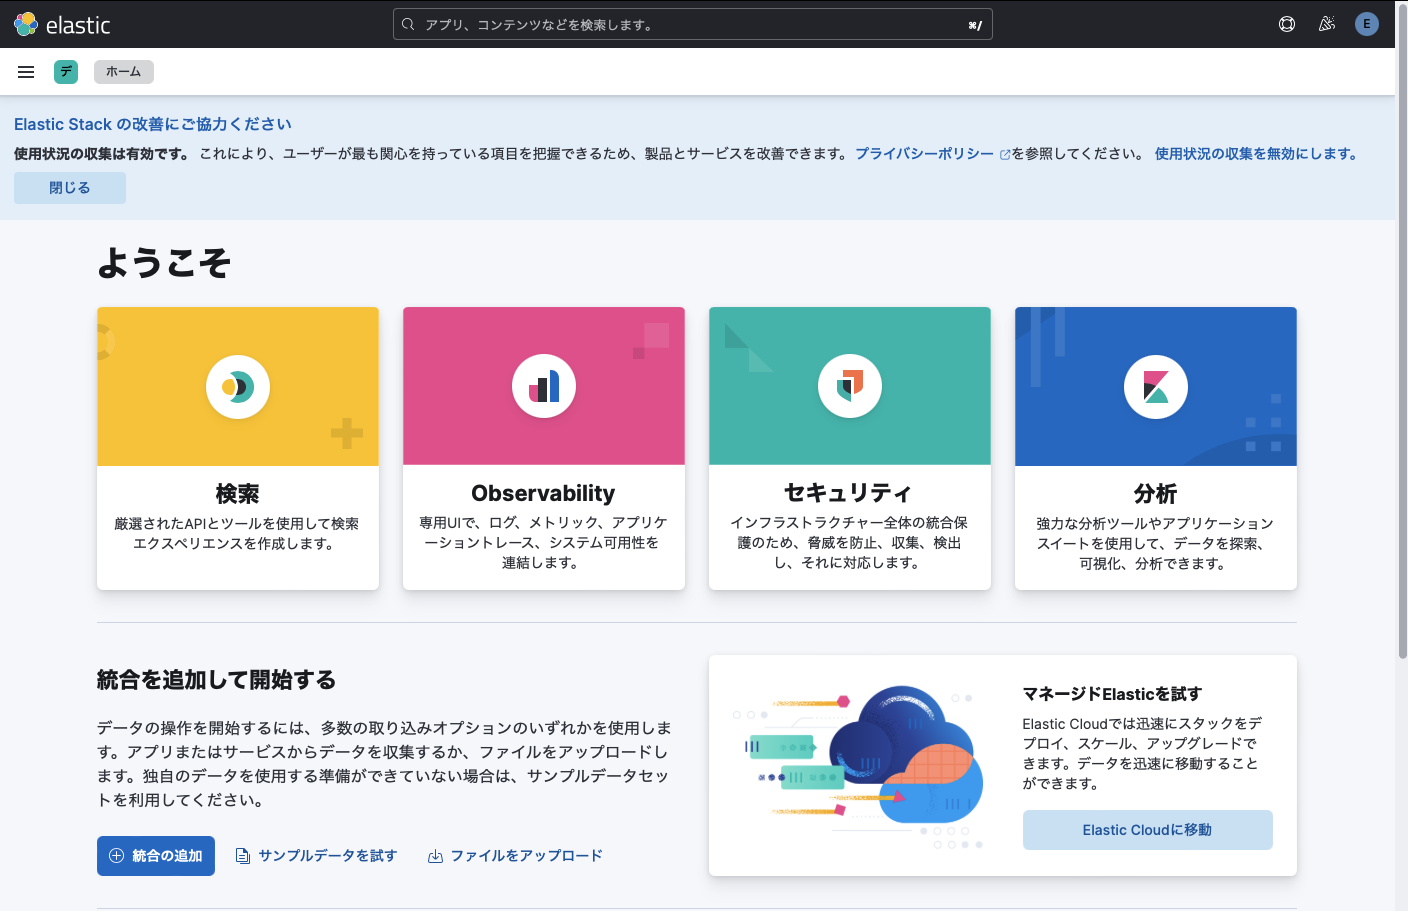
サンプルデータ操作
分析>ダッシュボードから、サンプルデータを追加するを選択します。
今回は「Sample web logs」を追加します。
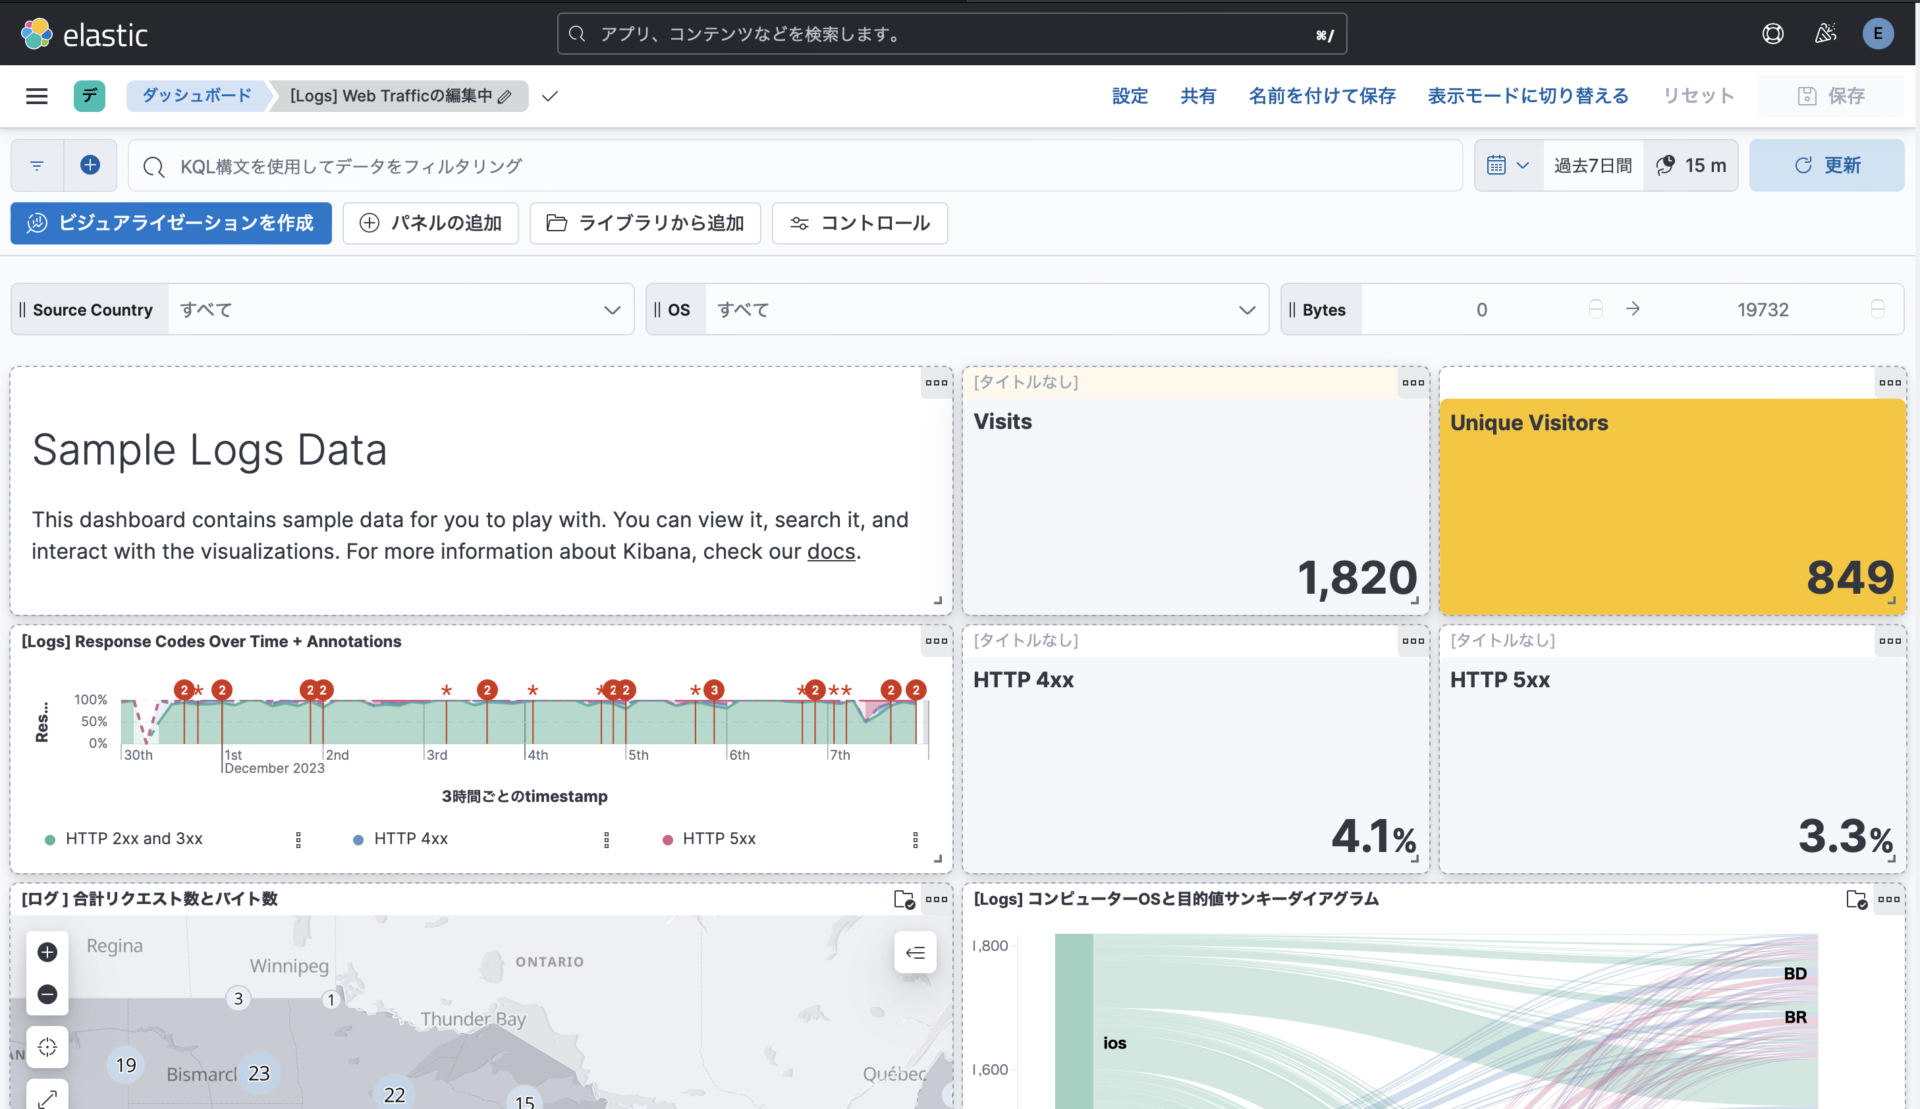
THE海外のツールって感じですね。
一番目立つ黄色のUnique Visitorsの詳細を見てみます。
ソースの値をを直出ししているみたいですね、
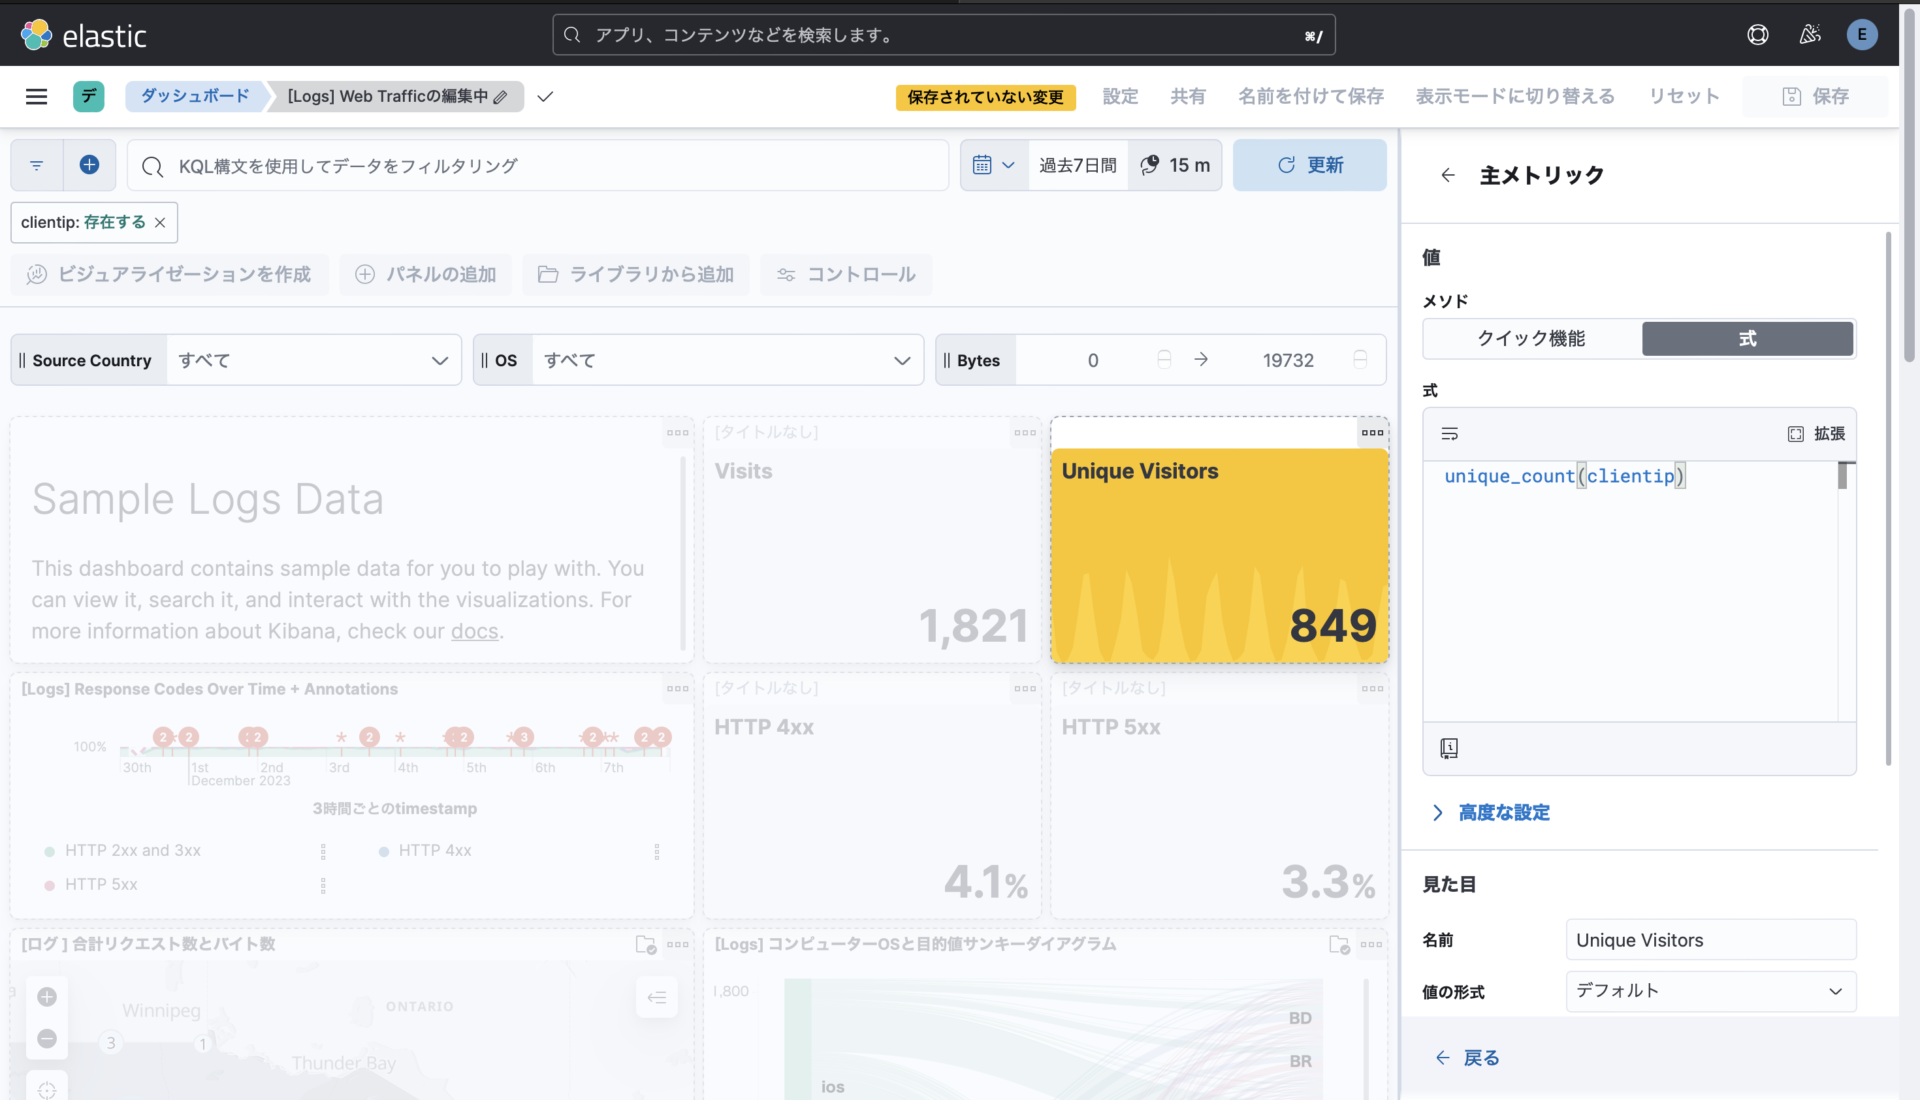
「コンピューターOSと目的値サンキーダイヤグラム」の項目を見てみます。
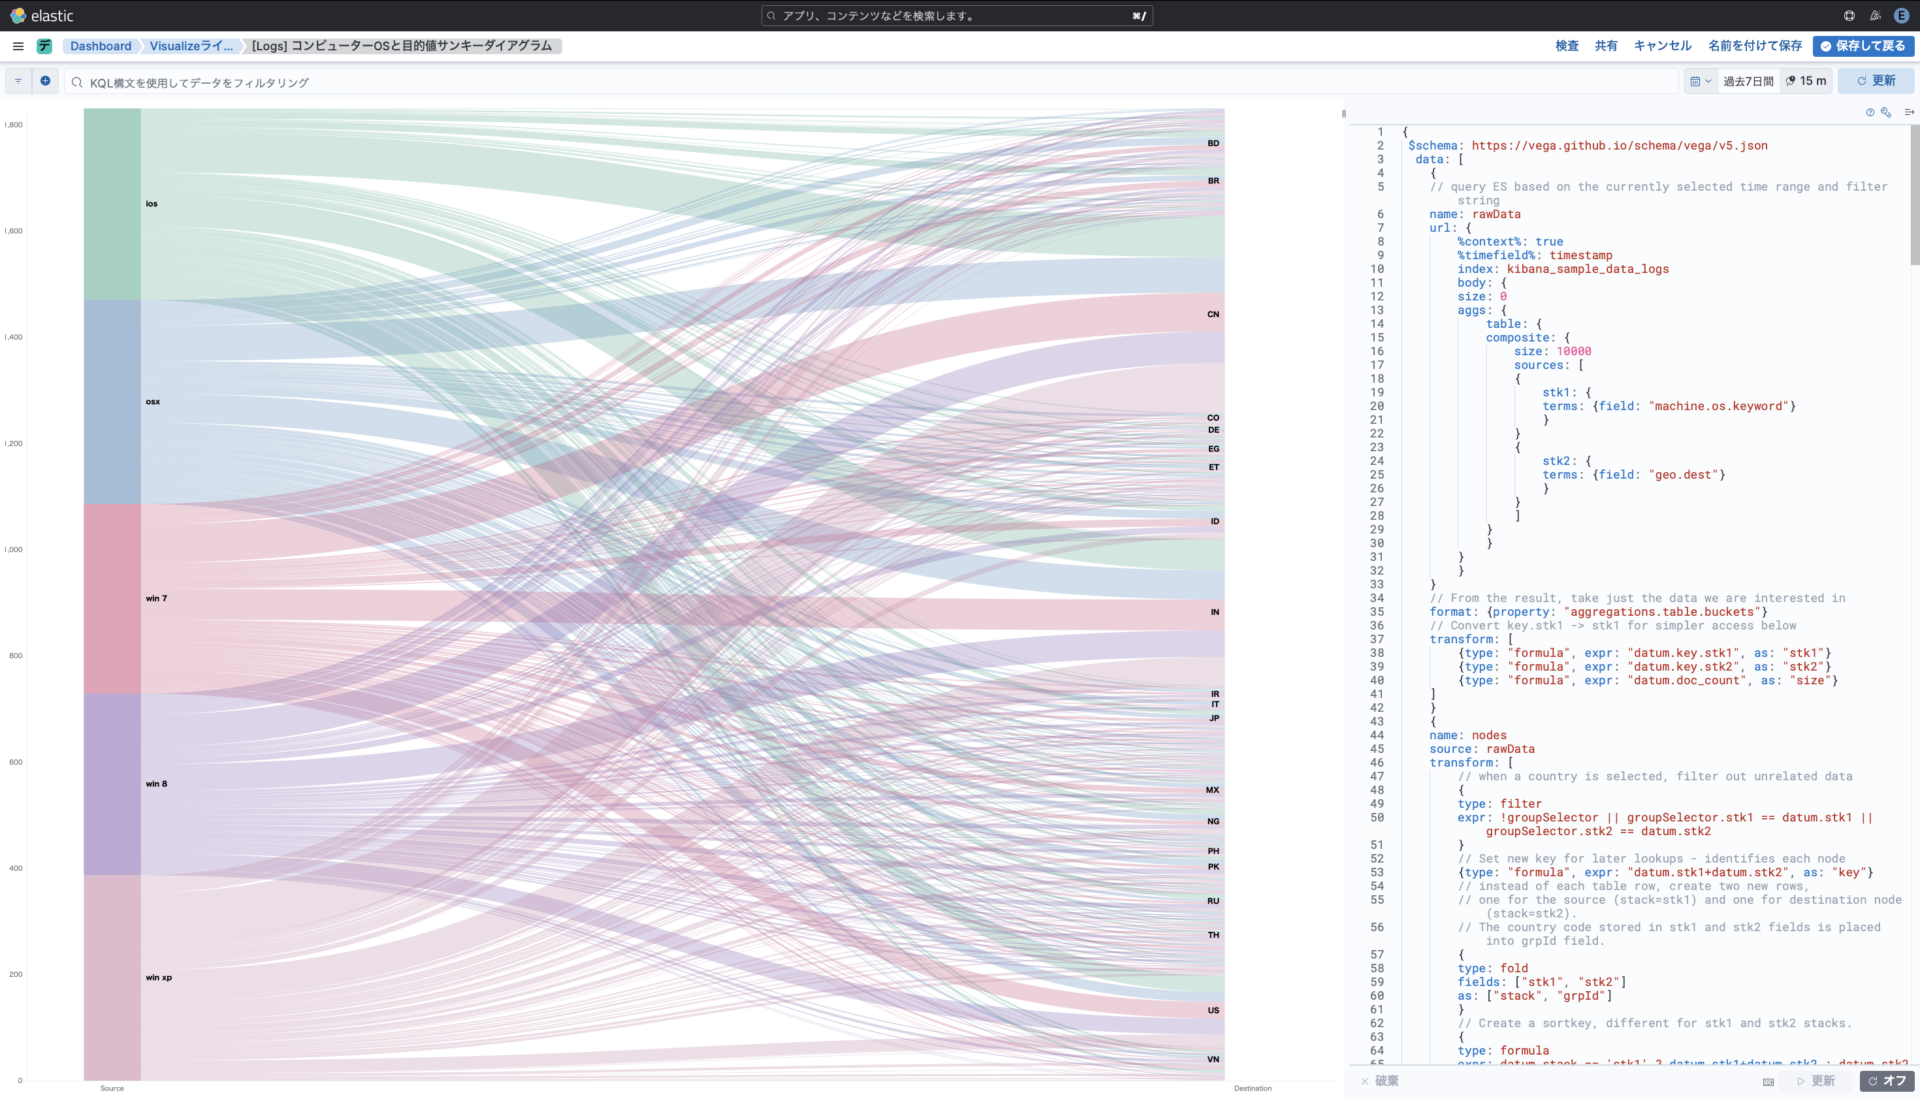
以下のようなコードによってグラフが表現されているようでした。
{
 $schema: https://vega.github.io/schema/vega/v5.json
  data: [
	{
  	// query ES based on the currently selected time range and filter string
  	name: rawData
  	url: {
    	%context%: true
    	%timefield%: timestamp
    	index: kibana_sample_data_logs
    	body: {
      	size: 0
      	aggs: {
        	table: {
          	composite: {
            	size: 10000
            	sources: [
              	{
                	stk1: {
                  	terms: {field: "machine.os.keyword"}
                	}
              	}
              	{
                	stk2: {
                  	terms: {field: "geo.dest"}
                	}
              	}
            	]
          	}
        	}
      	}
    	}
  	}
  	// From the result, take just the data we are interested in
  	format: {property: "aggregations.table.buckets"}
  	// Convert key.stk1 -> stk1 for simpler access below
  	transform: [
    	{type: "formula", expr: "datum.key.stk1", as: "stk1"}
    	{type: "formula", expr: "datum.key.stk2", as: "stk2"}
    	{type: "formula", expr: "datum.doc_count", as: "size"}
  	]
	}
	{
  	name: nodes
  	source: rawData
  	transform: [
    	// when a country is selected, filter out unrelated data
    	{
      	type: filter
      	expr: !groupSelector || groupSelector.stk1 == datum.stk1 || groupSelector.stk2 == datum.stk2
    	}
    	// Set new key for later lookups - identifies each node
    	{type: "formula", expr: "datum.stk1+datum.stk2", as: "key"}
    	// instead of each table row, create two new rows,
    	// one for the source (stack=stk1) and one for destination node (stack=stk2).
    	// The country code stored in stk1 and stk2 fields is placed into grpId field.
    	{
      	type: fold
      	fields: ["stk1", "stk2"]
      	as: ["stack", "grpId"]
    	}
    	// Create a sortkey, different for stk1 and stk2 stacks.
    	{
      	type: formula
      	expr: datum.stack == 'stk1' ? datum.stk1+datum.stk2 : datum.stk2+datum.stk1
      	as: sortField
    	}
    	// Calculate y0 and y1 positions for stacking nodes one on top of the other,
    	// independently for each stack, and ensuring they are in the proper order,
    	// alphabetical from the top (reversed on the y axis)
    	{
      	type: stack
      	groupby: ["stack"]
      	sort: {field: "sortField", order: "descending"}
      	field: size
    	}
    	// calculate vertical center point for each node, used to draw edges
    	{type: "formula", expr: "(datum.y0+datum.y1)/2", as: "yc"}
  	]
	}
	{
  	name: groups
  	source: nodes
  	transform: [
    	// combine all nodes into country groups, summing up the doc counts
    	{
      	type: aggregate
      	groupby: ["stack", "grpId"]
      	fields: ["size"]
      	ops: ["sum"]
      	as: ["total"]
    	}
    	// re-calculate the stacking y0,y1 values
    	{
      	type: stack
      	groupby: ["stack"]
      	sort: {field: "grpId", order: "descending"}
      	field: total
    	}
    	// project y0 and y1 values to screen coordinates
    	// doing it once here instead of doing it several times in marks
    	{type: "formula", expr: "scale('y', datum.y0)", as: "scaledY0"}
    	{type: "formula", expr: "scale('y', datum.y1)", as: "scaledY1"}
    	// boolean flag if the label should be on the right of the stack
    	{type: "formula", expr: "datum.stack == 'stk1'", as: "rightLabel"}
    	// Calculate traffic percentage for this country using "y" scale
    	// domain upper bound, which represents the total traffic
    	{
      	type: formula
      	expr: datum.total/domain('y')[1]
      	as: percentage
    	}
  	]
	}
	{
  	// This is a temp lookup table with all the 'stk2' stack nodes
  	name: destinationNodes
  	source: nodes
  	transform: [
    	{type: "filter", expr: "datum.stack == 'stk2'"}
  	]
	}
	{
  	name: edges
  	source: nodes
  	transform: [
    	// we only want nodes from the left stack
    	{type: "filter", expr: "datum.stack == 'stk1'"}
    	// find corresponding node from the right stack, keep it as "target"
    	{
      	type: lookup
      	from: destinationNodes
      	key: key
      	fields: ["key"]
      	as: ["target"]
    	}
    	// calculate SVG link path between stk1 and stk2 stacks for the node pair
    	{
      	type: linkpath
      	orient: horizontal
      	shape: diagonal
      	sourceY: {expr: "scale('y', datum.yc)"}
      	sourceX: {expr: "scale('x', 'stk1') + bandwidth('x')"}
      	targetY: {expr: "scale('y', datum.target.yc)"}
      	targetX: {expr: "scale('x', 'stk2')"}
    	}
    	// A little trick to calculate the thickness of the line.
    	// The value needs to be the same as the hight of the node, but scaling
    	// size to screen's height gives inversed value because screen's Y
    	// coordinate goes from the top to the bottom, whereas the graph's Y=0
    	// is at the bottom. So subtracting scaled doc count from screen height
    	// (which is the "lower" bound of the "y" scale) gives us the right value
    	{
      	type: formula
      	expr: range('y')[0]-scale('y', datum.size)
      	as: strokeWidth
    	}
    	// Tooltip needs individual link's percentage of all traffic
    	{
      	type: formula
      	expr: datum.size/domain('y')[1]
      	as: percentage
    	}
  	]
	}
  ]
  scales: [
	{
  	// calculates horizontal stack positioning
  	name: x
  	type: band
  	range: width
  	domain: ["stk1", "stk2"]
  	paddingOuter: 0.05
  	paddingInner: 0.95
	}
	{
  	// this scale goes up as high as the highest y1 value of all nodes
  	name: y
  	type: linear
  	range: height
  	domain: {data: "nodes", field: "y1"}
	}
	{
  	// use rawData to ensure the colors stay the same when clicking.
  	name: color
  	type: ordinal
  	range: category
  	domain: {data: "rawData", field: "stk1"}
	}
	{
  	// this scale is used to map internal ids (stk1, stk2) to stack names
  	name: stackNames
  	type: ordinal
  	range: ["Source", "Destination"]
  	domain: ["stk1", "stk2"]
	}
  ]
  axes: [
	{
  	// x axis should use custom label formatting to print proper stack names
  	orient: bottom
  	scale: x
  	encode: {
    	labels: {
      	update: {
        	text: {scale: "stackNames", field: "value"}
      	}
    	}
  	}
	}
	{orient: "left", scale: "y"}
  ]
  marks: [
	{
  	// draw the connecting line between stacks
  	type: path
  	name: edgeMark
  	from: {data: "edges"}
  	// this prevents some autosizing issues with large strokeWidth for paths
  	clip: true
  	encode: {
    	update: {
      	// By default use color of the left node, except when showing traffic
      	// from just one country, in which case use destination color.
      	stroke: [
        	{
          	test: groupSelector && groupSelector.stack=='stk1'
          	scale: color
          	field: stk2
        	}
        	{scale: "color", field: "stk1"}
      	]
      	strokeWidth: {field: "strokeWidth"}
      	path: {field: "path"}
      	// when showing all traffic, and hovering over a country,
      	// highlight the traffic from that country.
      	strokeOpacity: {
        	signal: !groupSelector && (groupHover.stk1 == datum.stk1 || groupHover.stk2 == datum.stk2) ? 0.9 : 0.3
      	}
      	// Ensure that the hover-selected edges show on top
      	zindex: {
        	signal: !groupSelector && (groupHover.stk1 == datum.stk1 || groupHover.stk2 == datum.stk2) ? 1 : 0
      	}
      	// format tooltip string
      	tooltip: {
        	signal: datum.stk1 + ' → ' + datum.stk2 + '	' + format(datum.size, ',.0f') + '   (' + format(datum.percentage, '.1%') + ')'
      	}
    	}
    	// Simple mouseover highlighting of a single line
    	hover: {
      	strokeOpacity: {value: 1}
    	}
  	}
	}
	{
  	// draw stack groups (countries)
  	type: rect
  	name: groupMark
  	from: {data: "groups"}
  	encode: {
    	enter: {
      	fill: {scale: "color", field: "grpId"}
      	width: {scale: "x", band: 1}
    	}
    	update: {
      	x: {scale: "x", field: "stack"}
      	y: {field: "scaledY0"}
      	y2: {field: "scaledY1"}
      	fillOpacity: {value: 0.6}
      	tooltip: {
        	signal: datum.grpId + '   ' + format(datum.total, ',.0f') + '   (' + format(datum.percentage, '.1%') + ')'
      	}
    	}
    	hover: {
      	fillOpacity: {value: 1}
    	}
  	}
	}
	{
  	// draw country code labels on the inner side of the stack
  	type: text
  	from: {data: "groups"}
  	// don't process events for the labels - otherwise line mouseover is unclean
  	interactive: false
  	encode: {
    	update: {
      	// depending on which stack it is, position x with some padding
      	x: {
        	signal: scale('x', datum.stack) + (datum.rightLabel ? bandwidth('x') + 8 : -8)
      	}
      	// middle of the group
      	yc: {signal: "(datum.scaledY0 + datum.scaledY1)/2"}
      	align: {signal: "datum.rightLabel ? 'left' : 'right'"}
      	baseline: {value: "middle"}
      	fontWeight: {value: "bold"}
      	// only show text label if the group's height is large enough
      	text: {signal: "abs(datum.scaledY0-datum.scaledY1) > 13 ? datum.grpId : ''"}
    	}
  	}
	}
	{
  	// Create a "show all" button. Shown only when a country is selected.
  	type: group
  	data: [
    	// We need to make the button show only when groupSelector signal is true.
    	// Each mark is drawn as many times as there are elements in the backing data.
    	// Which means that if values list is empty, it will not be drawn.
    	// Here I create a data source with one empty object, and filter that list
    	// based on the signal value. This can only be done in a group.
    	{
      	name: dataForShowAll
      	values: [{}]
      	transform: [{type: "filter", expr: "groupSelector"}]
    	}
  	]
  	// Set button size and positioning
  	encode: {
    	enter: {
      	xc: {signal: "width/2"}
      	y: {value: 30}
      	width: {value: 80}
      	height: {value: 30}
    	}
  	}
  	marks: [
    	{
      	// This group is shown as a button with rounded corners.
      	type: group
      	// mark name allows signal capturing
      	name: groupReset
      	// Only shows button if dataForShowAll has values.
      	from: {data: "dataForShowAll"}
      	encode: {
        	enter: {
          	cornerRadius: {value: 6}
          	fill: {value: "#F5F7FA"}
          	stroke: {value: "#c1c1c1"}
          	strokeWidth: {value: 2}
          	// use parent group's size
          	height: {
            	field: {group: "height"}
          	}
          	width: {
            	field: {group: "width"}
          	}
        	}
        	update: {
          	// groups are transparent by default
          	opacity: {value: 1}
        	}
        	hover: {
          	opacity: {value: 0.7}
        	}
      	}
      	marks: [
        	{
          	type: text
          	// if true, it will prevent clicking on the button when over text.
          	interactive: false
          	encode: {
            	enter: {
              	// center text in the paren group
              	xc: {
                	field: {group: "width"}
                	mult: 0.5
              	}
              	yc: {
                	field: {group: "height"}
                	mult: 0.5
                	offset: 2
              	}
              	align: {value: "center"}
              	baseline: {value: "middle"}
              	fontWeight: {value: "bold"}
              	text: {value: "Show All"}
            	}
          	}
        	}
      	]
    	}
  	]
	}
  ]
  signals: [
	{
  	// used to highlight traffic to/from the same country
  	name: groupHover
  	value: {}
  	on: [
    	{
      	events: @groupMark:mouseover
      	update: "{stk1:datum.stack=='stk1' && datum.grpId, stk2:datum.stack=='stk2' && datum.grpId}"
    	}
    	{events: "mouseout", update: "{}"}
  	]
	}
	// used to filter only the data related to the selected country
	{
  	name: groupSelector
  	value: false
  	on: [
    	{
      	// Clicking groupMark sets this signal to the filter values
      	events: @groupMark:click!
      	update: "{stack:datum.stack, stk1:datum.stack=='stk1' && datum.grpId, stk2:datum.stack=='stk2' && datum.grpId}"
    	}
    	{
      	// Clicking "show all" button, or double-clicking anywhere resets it
      	events: [
        	{type: "click", markname: "groupReset"}
        	{type: "dblclick"}
      	]
      	update: "false"
    	}
  	]
	}
  ]
}
JSONっぽい何かが記載されていますが、知見がなかったのでAIに解説してもらいます。
このコードは、VegaビジュアライゼーションのためのJSON構造を示しています。Vegaは、データを視覚化するための宣言型言語であり、主にウェブベースのアプリケーションで使用されます。この特定のコードは、データを処理し、それを視覚的な表現に変換するための一連の指示を含んでいます。以下に、主要なセクションとその役割について詳しく説明します。
$schema:
- Vegaのバージョンを指定するためのスキーマURLです。
data:
- ビジュアライゼーションのためのデータソースを定義します。例えば、Elasticsearchからのデータを取得し、それを処理するための構造が含まれています。
- 各データブロックは、データの取得、変換、そして処理の手順を定義します。
scales:
- データを画面上のピクセル値にマッピングするためのスケール(比例尺)を設定します。
- 例えば、バンドスケール(
band)やリニアスケール(linear)などがあります。axes:
- グラフの軸を定義します。ここでは、水平方向(
bottom)と垂直方向(left)の軸が設定されています。marks:
- データの視覚的表現を定義します。この例では、パス(
path)、矩形(rect)、テキスト(text)などが使用されています。signals:
- インタラクティブな要素や動的な挙動を制御するためのシグナルを定義します。
- ユーザーのアクション(マウスオーバーやクリックなど)に応じてデータや表示を変更するために使用されます。
このコードは、複雑なデータセットを分析し、それを視覚的に表現するためのインタラクティブなグラフやチャートを作成するためのものです。データの集計、フィルタリング、スタック化、そしてそれをグラフィカルに表示するための詳細な設定が含まれています。特に、データのソースとしてElasticsearchを使用し、それをさまざまな形式で処理しています。
ChatGPT
こういう系のツールはJSで処理を書いちゃうイメージでしたが、こういったものもあるんですね。
参考ドキュメント
・公式ドキュメント
https://www.elastic.co/guide/en/elasticsearch/reference/current/docker.html#docker
・Dockerのイメージタグ
https://www.docker.elastic.co/r/elasticsearch
最後に
BIツールは基本英語でとっつきにくいイメージでしたが、日本語のドキュメントやプラグインも充実しているようだったので、触ってみました。
直感的に触り見ることはできると思いますが、設定自体をするのは結構な学習コストがありそうですね。。。
取り込むデータのフォーマット次第ではだいぶ苦慮しそうな感じはありますが、AIに突っ込んじゃえばどうにかなるでしょう笑
以上、簡単な入門記事でした。
どなたかのお役に立てれば幸いです。
